Grafana Dashboards
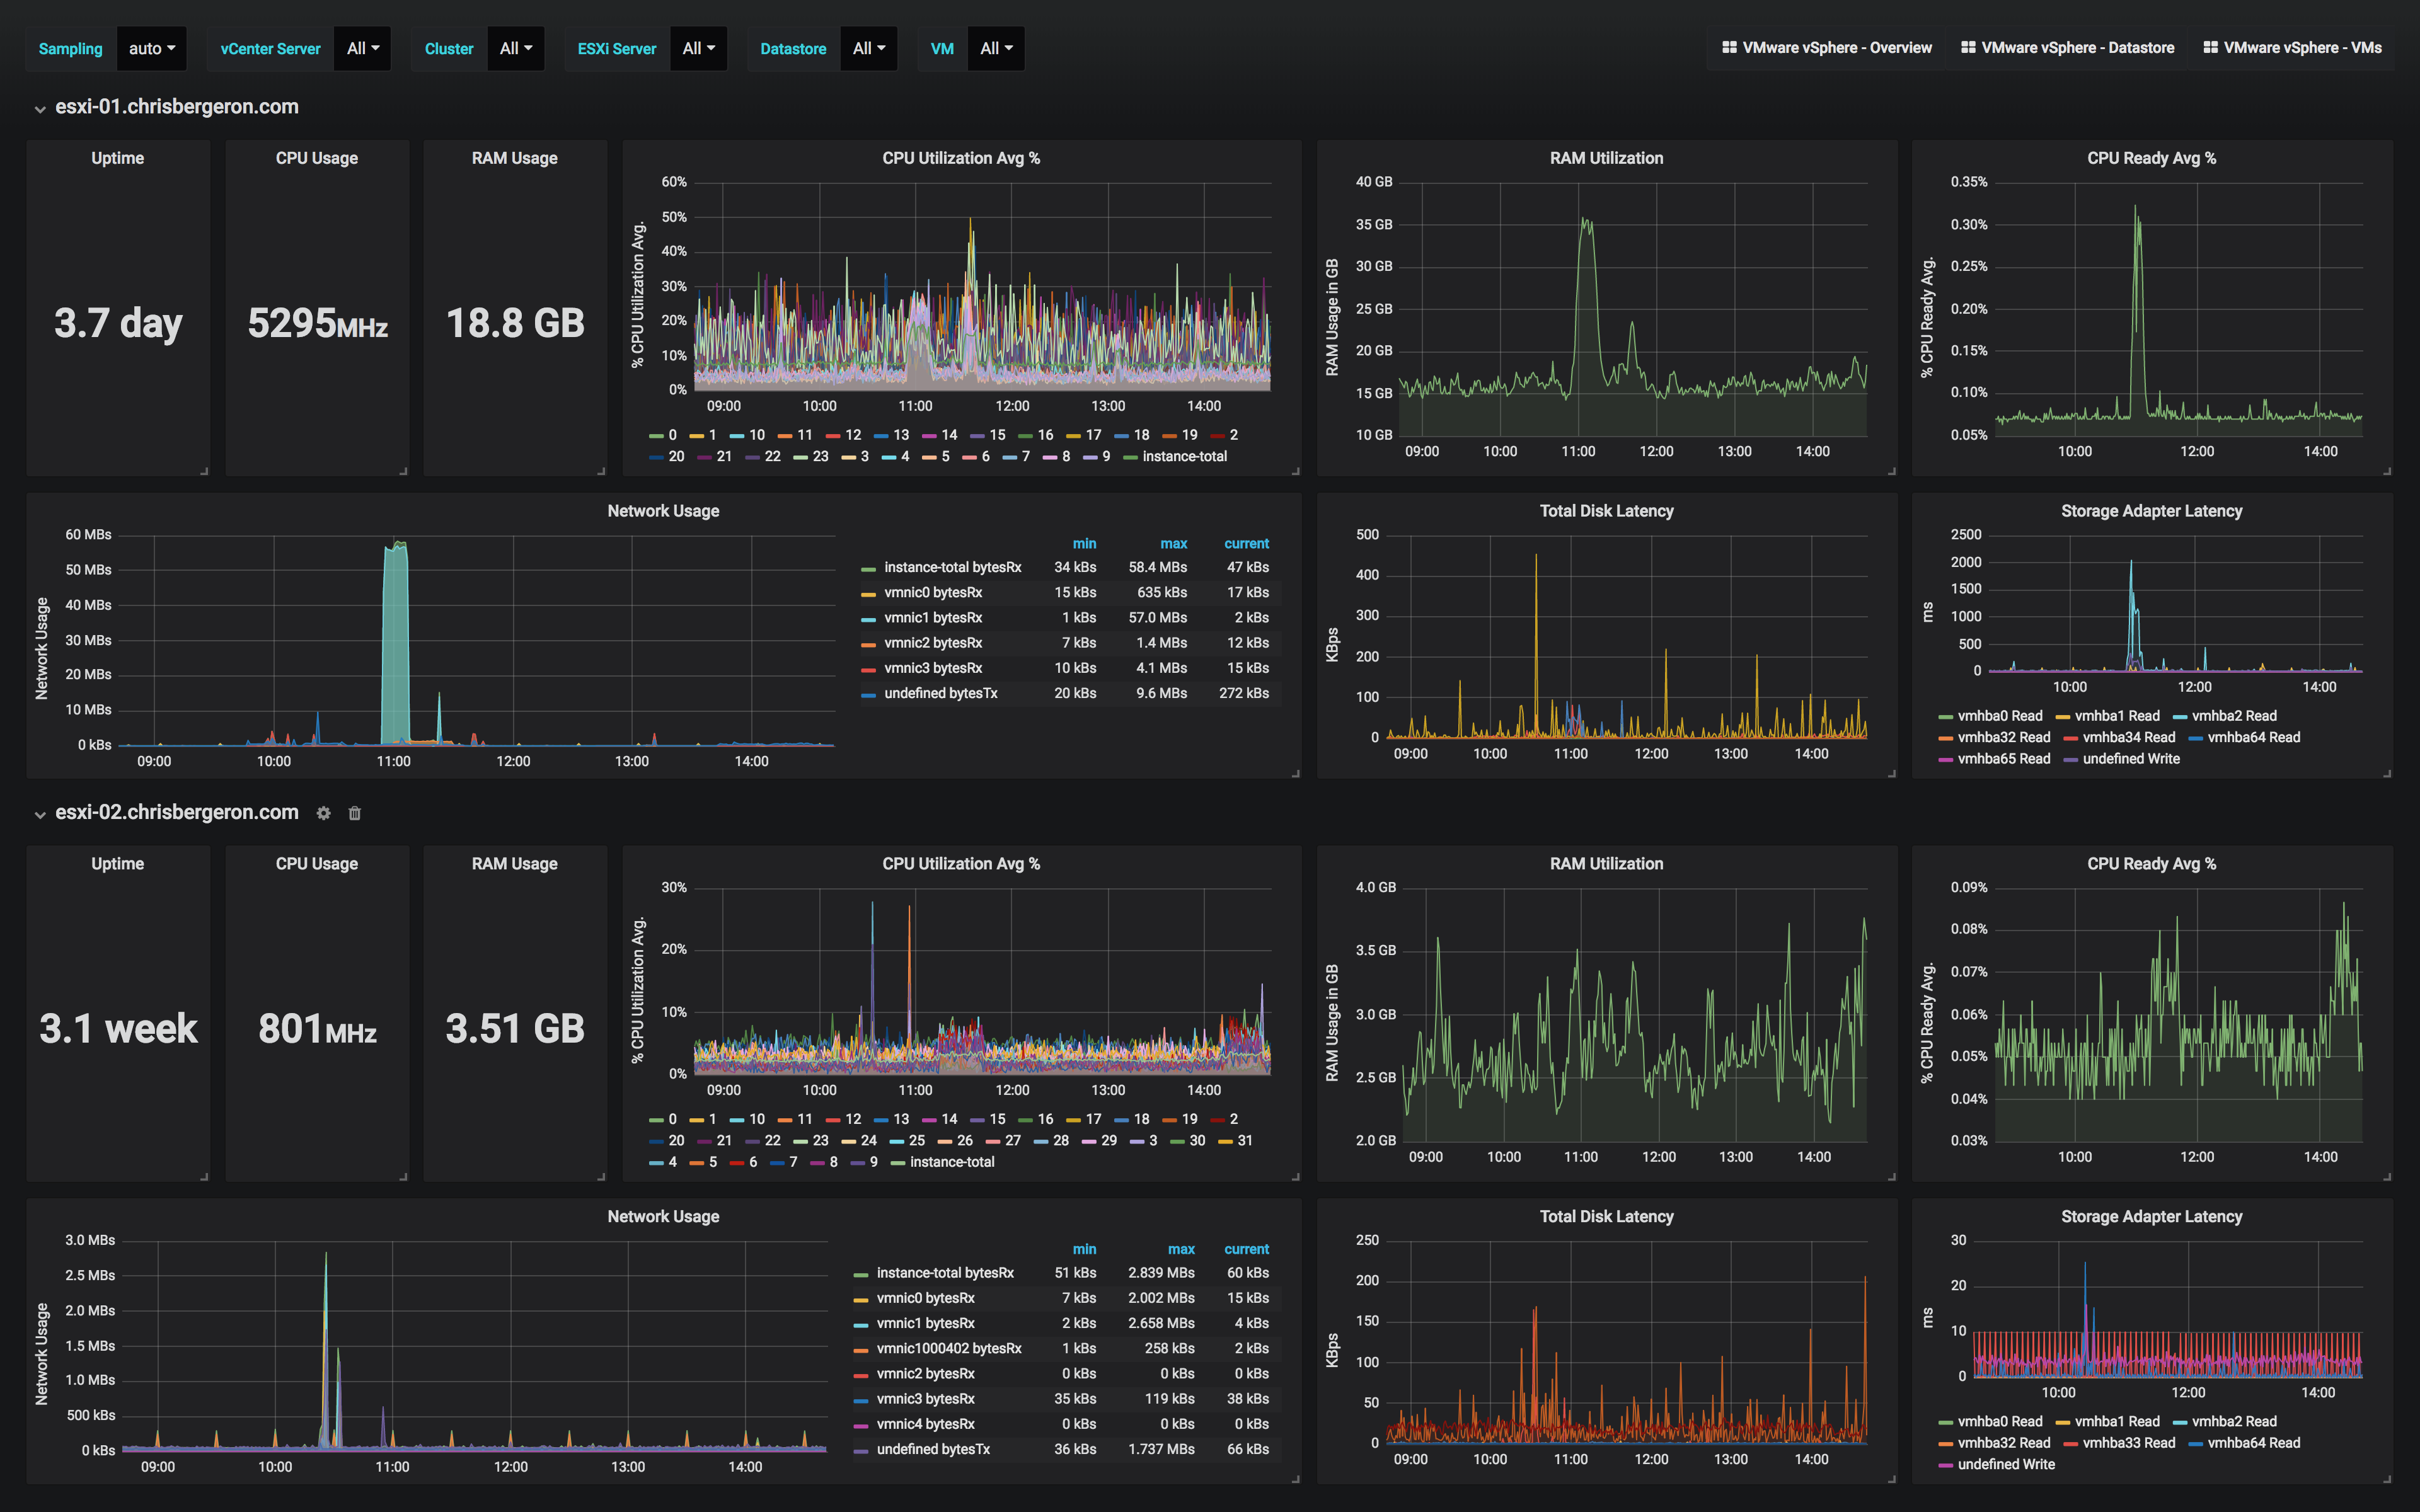
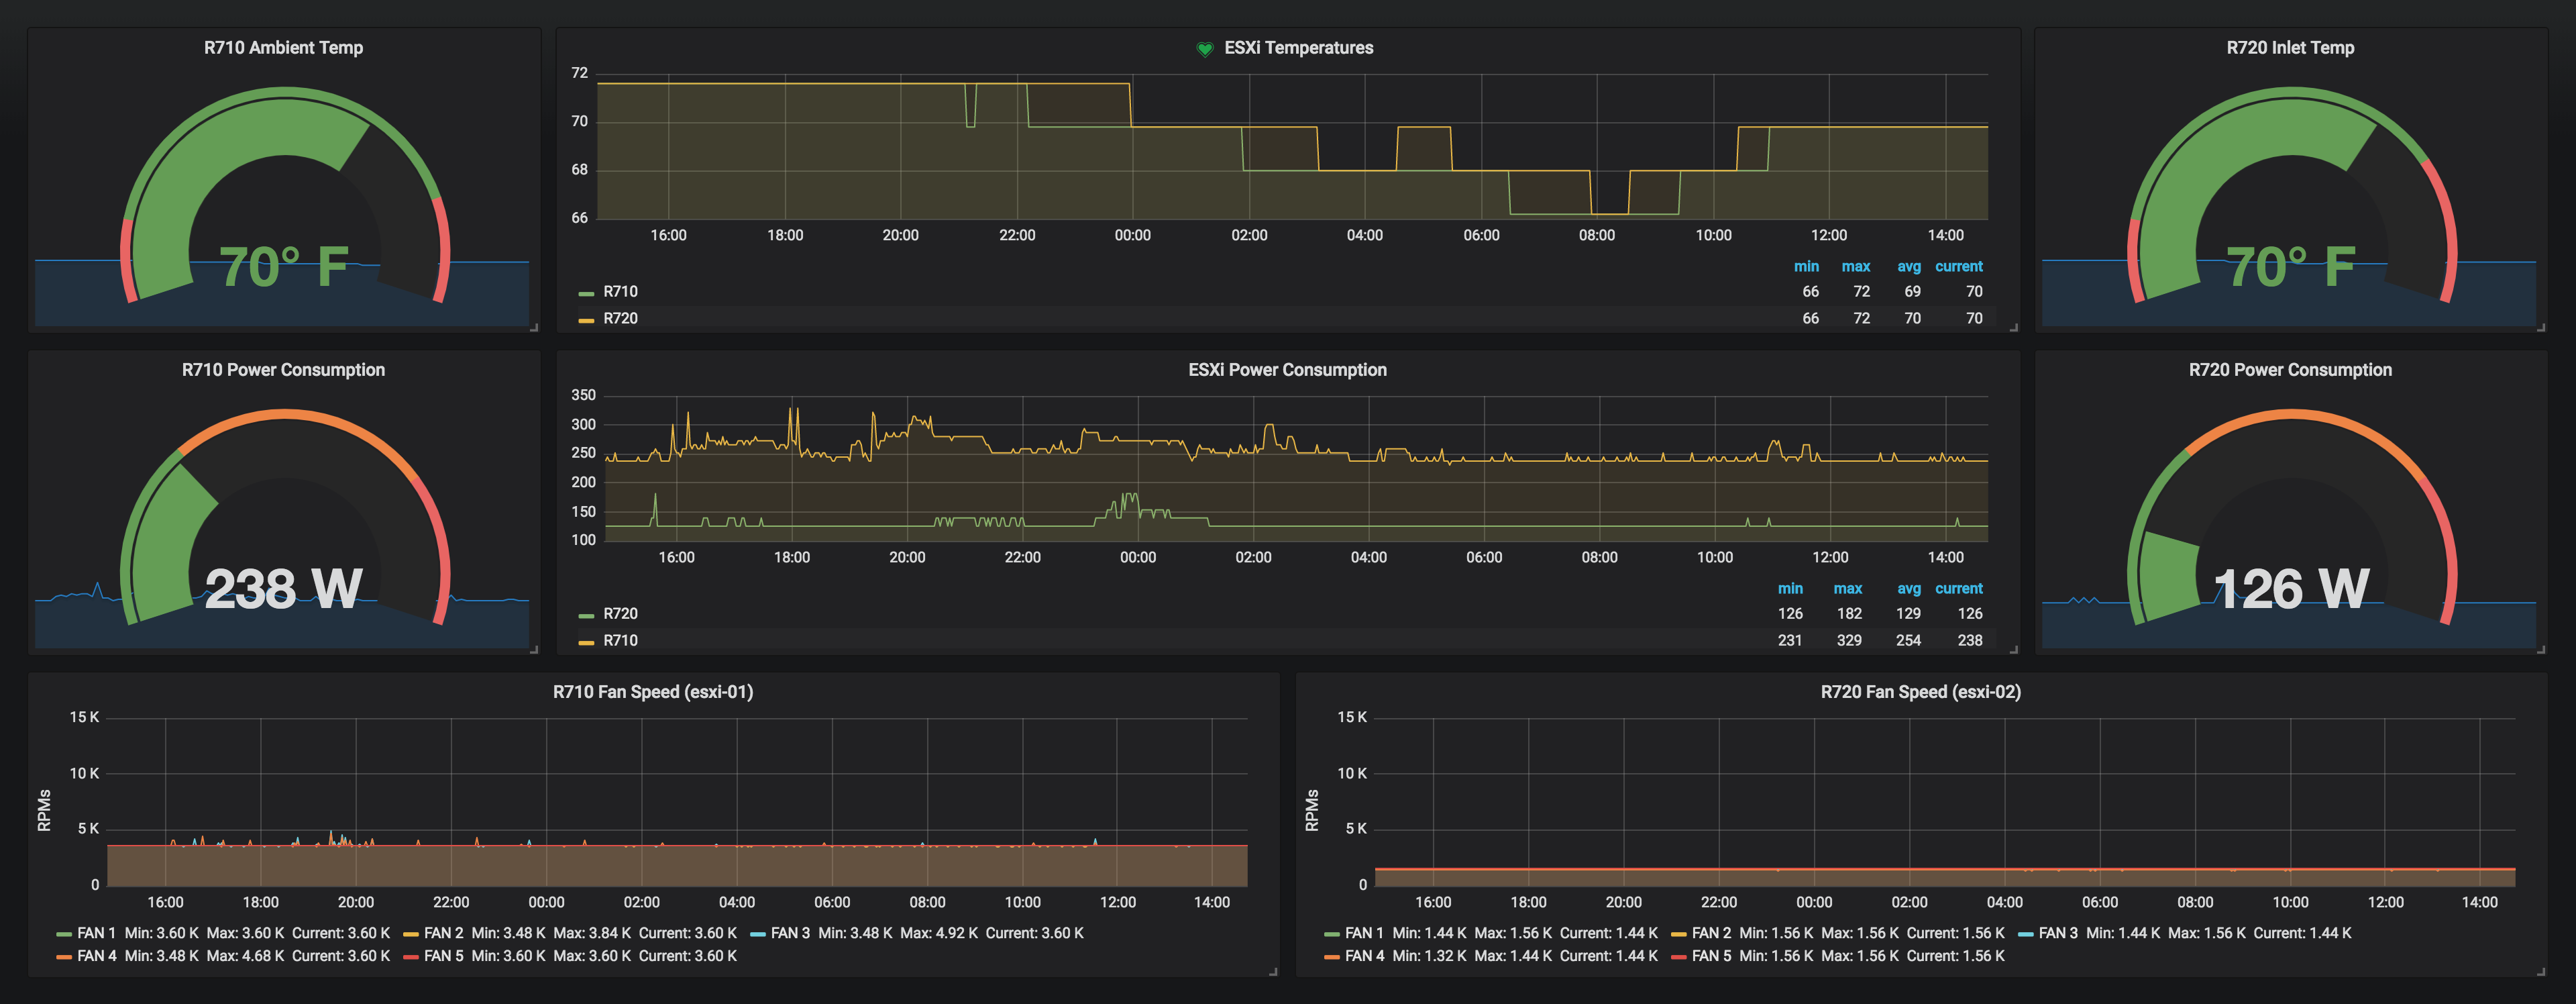
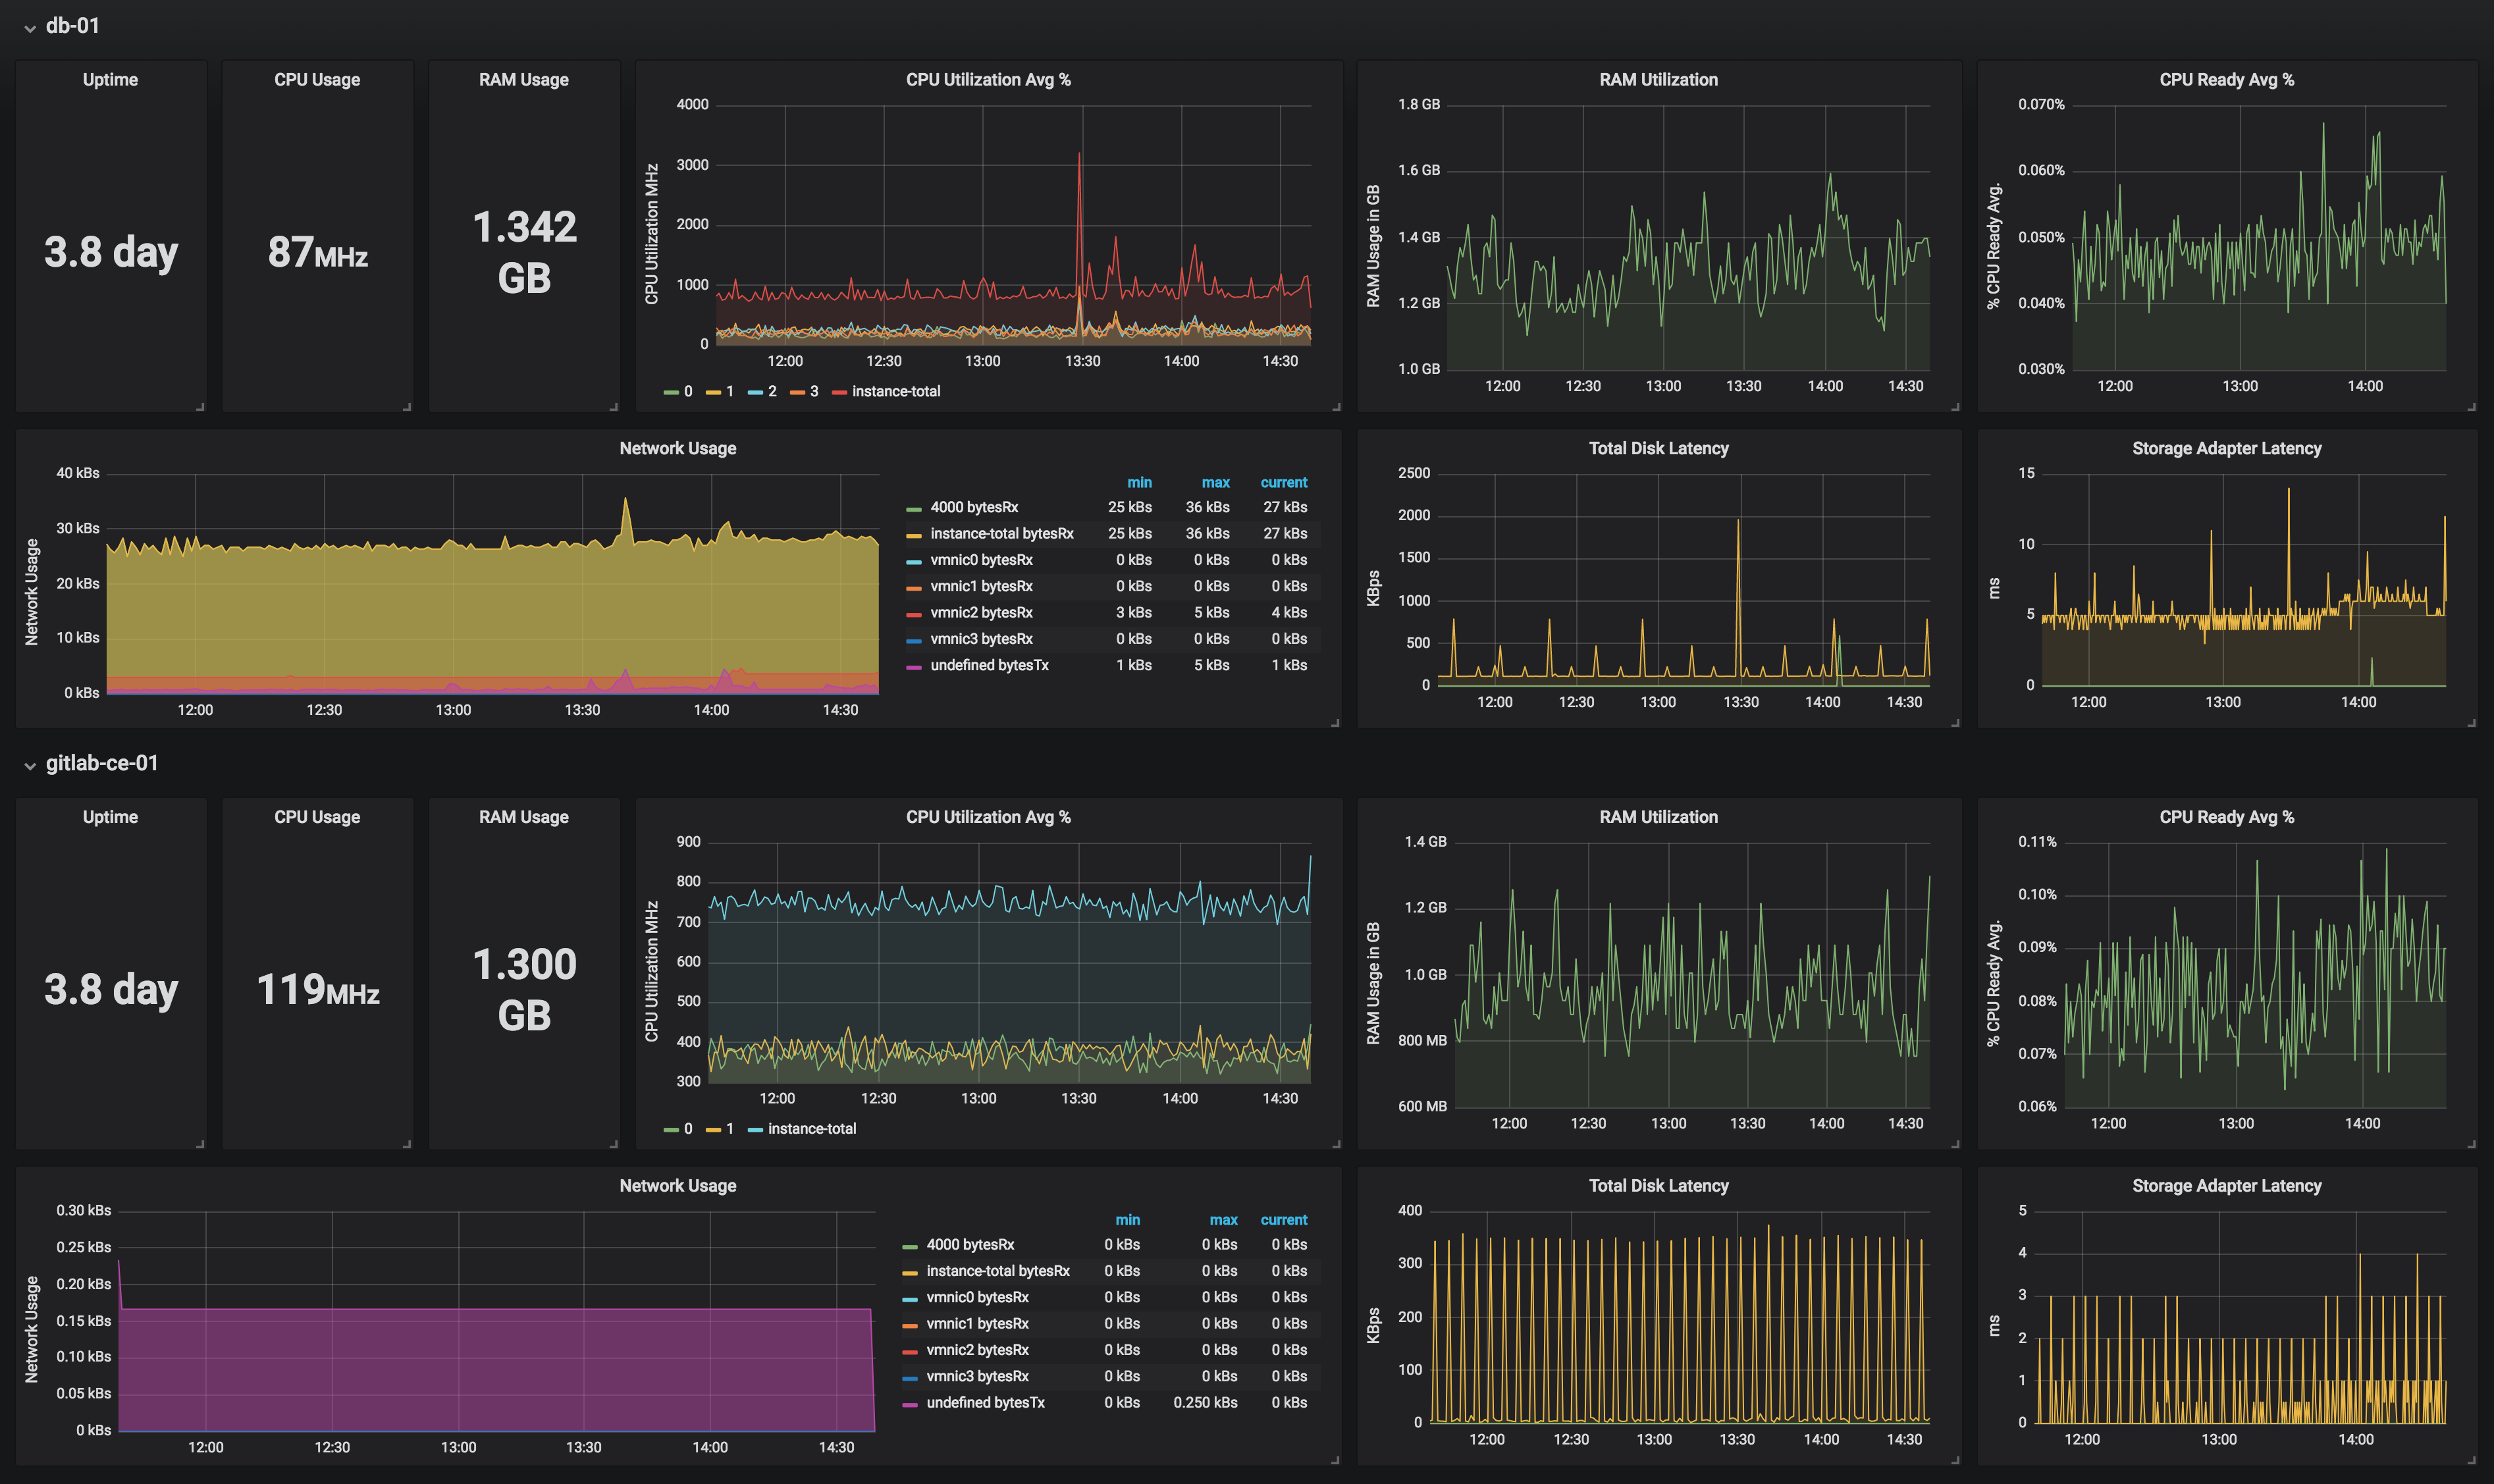
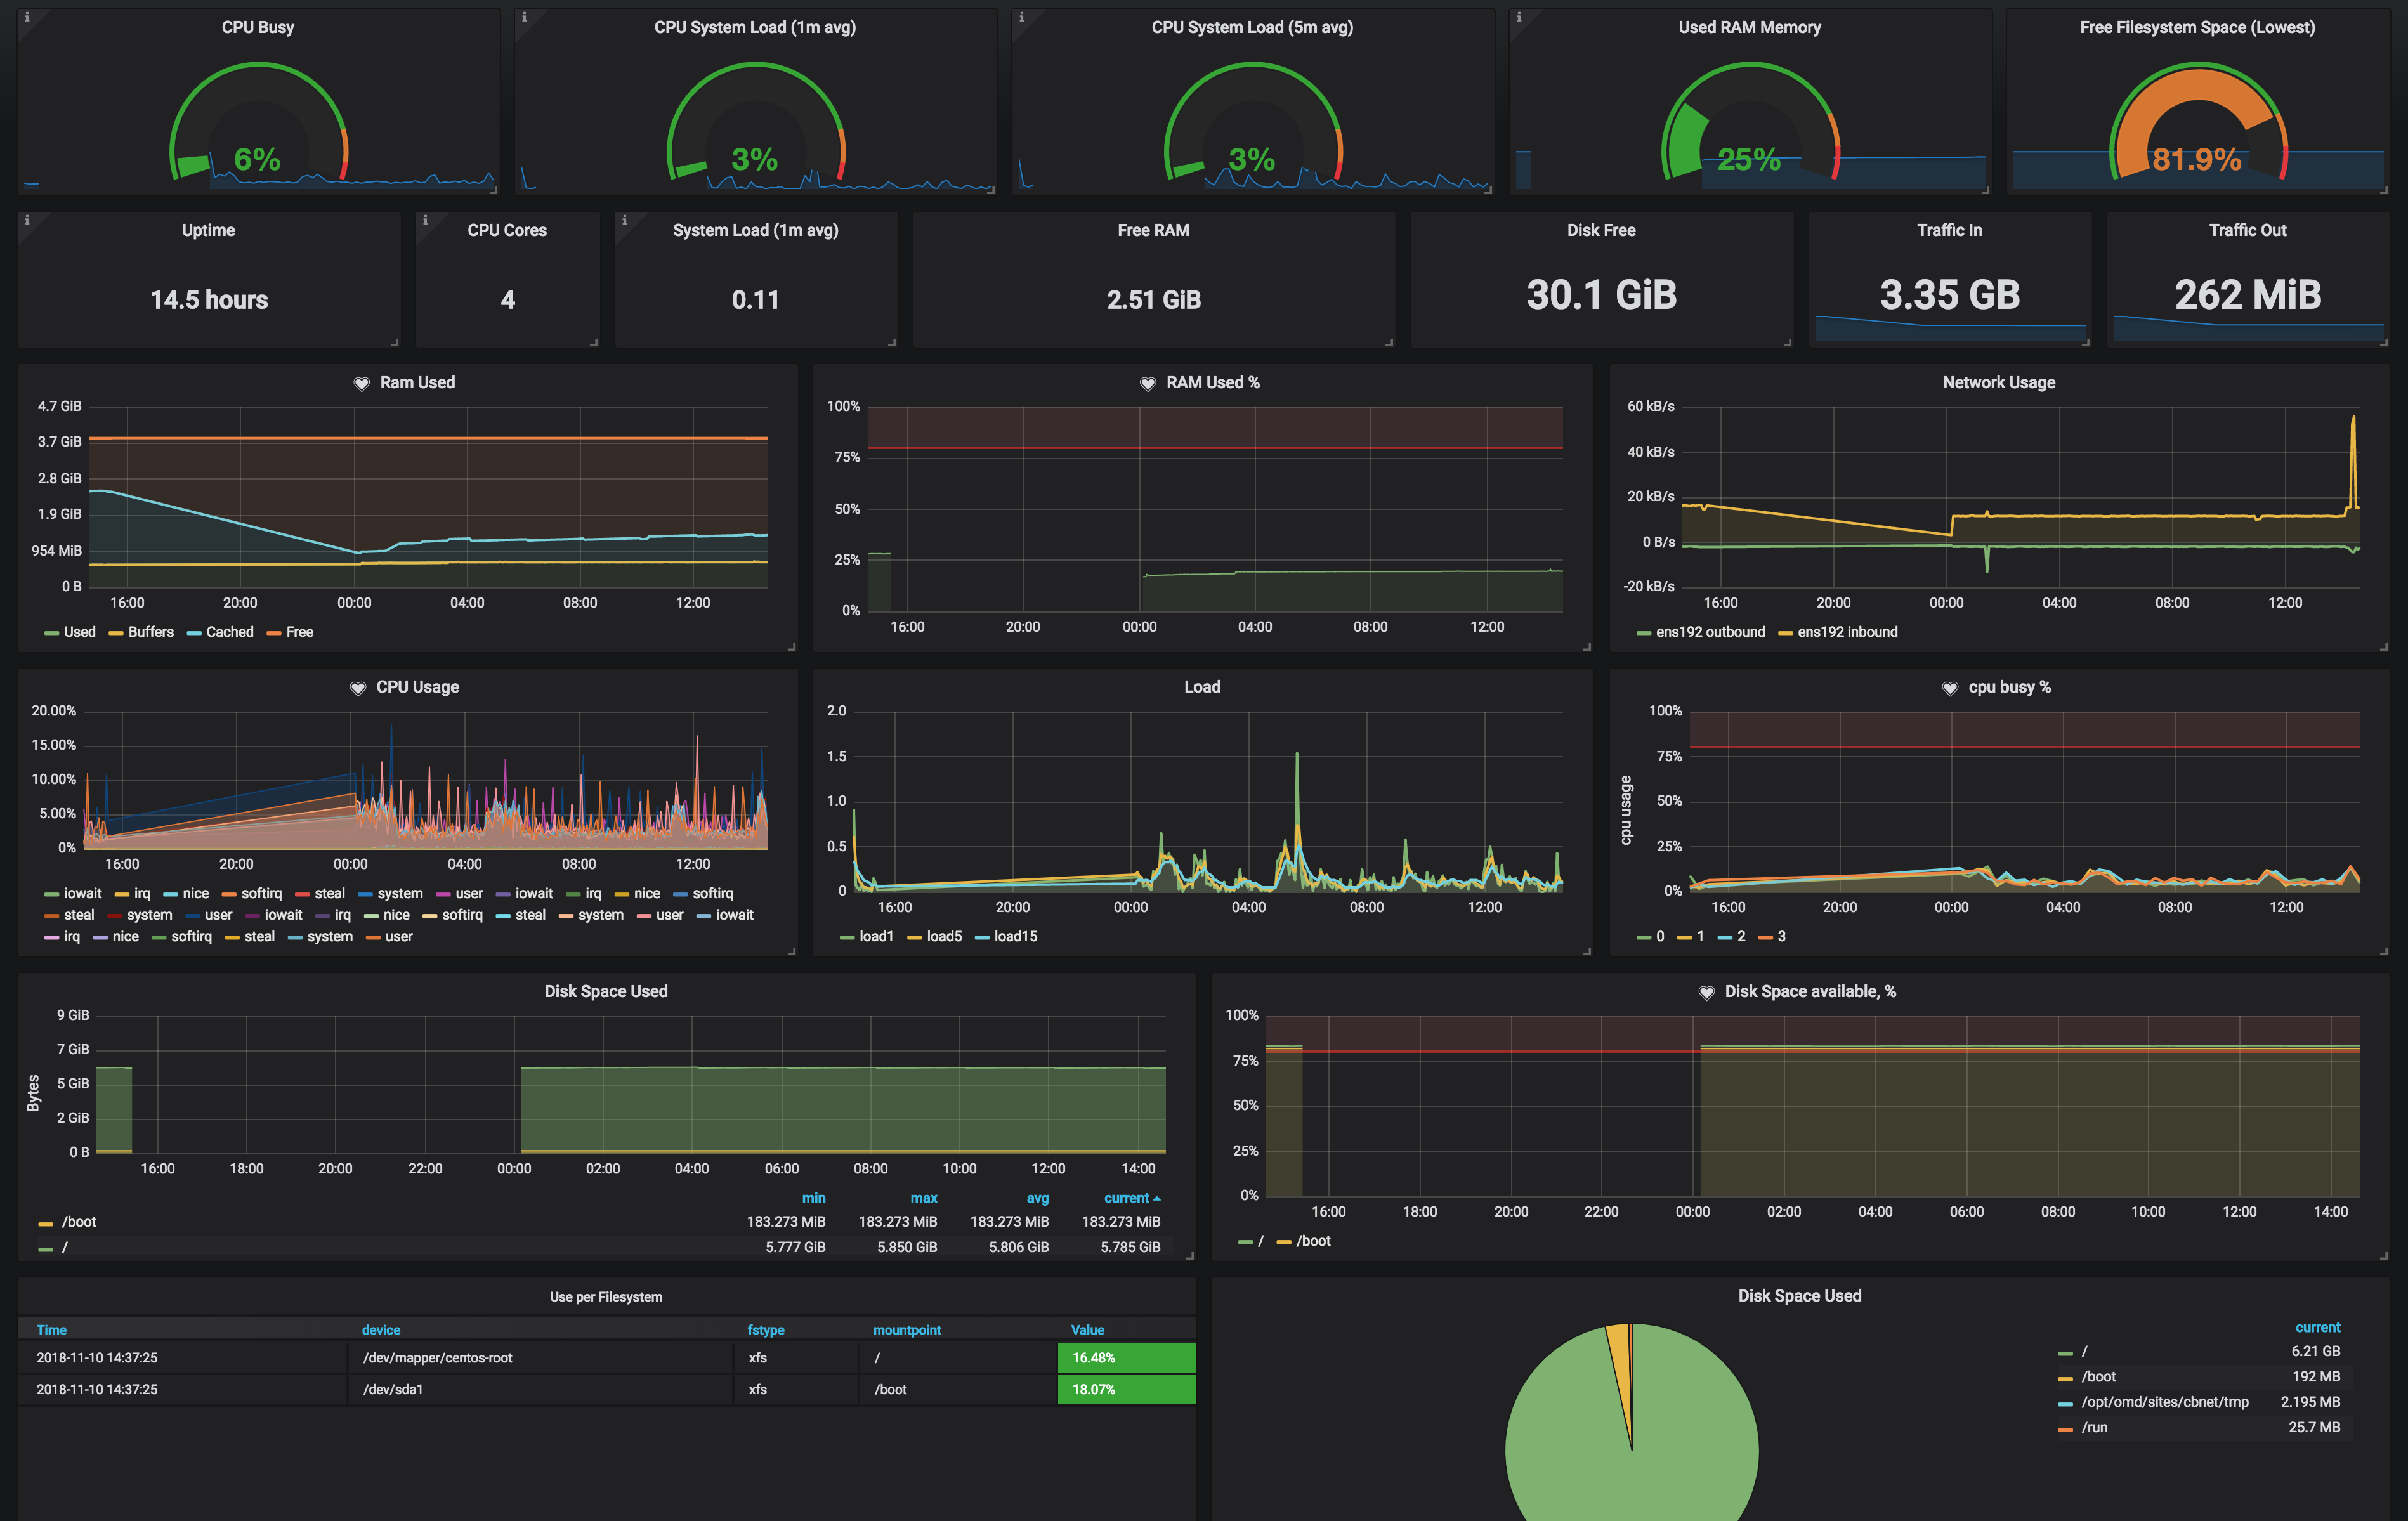
Grafana is a really great tool for visualizing data. In my homelab, I have obviously have a lot of data so what better than to use than the right tool for the job. Below, you can find some screenshots of my dashboards. I use a raspberry pi that just runs a full screen browser for viewing the dashboard slideshow in addition to a few other glance boards (DAKBoard, Monitorr, et al).
 | 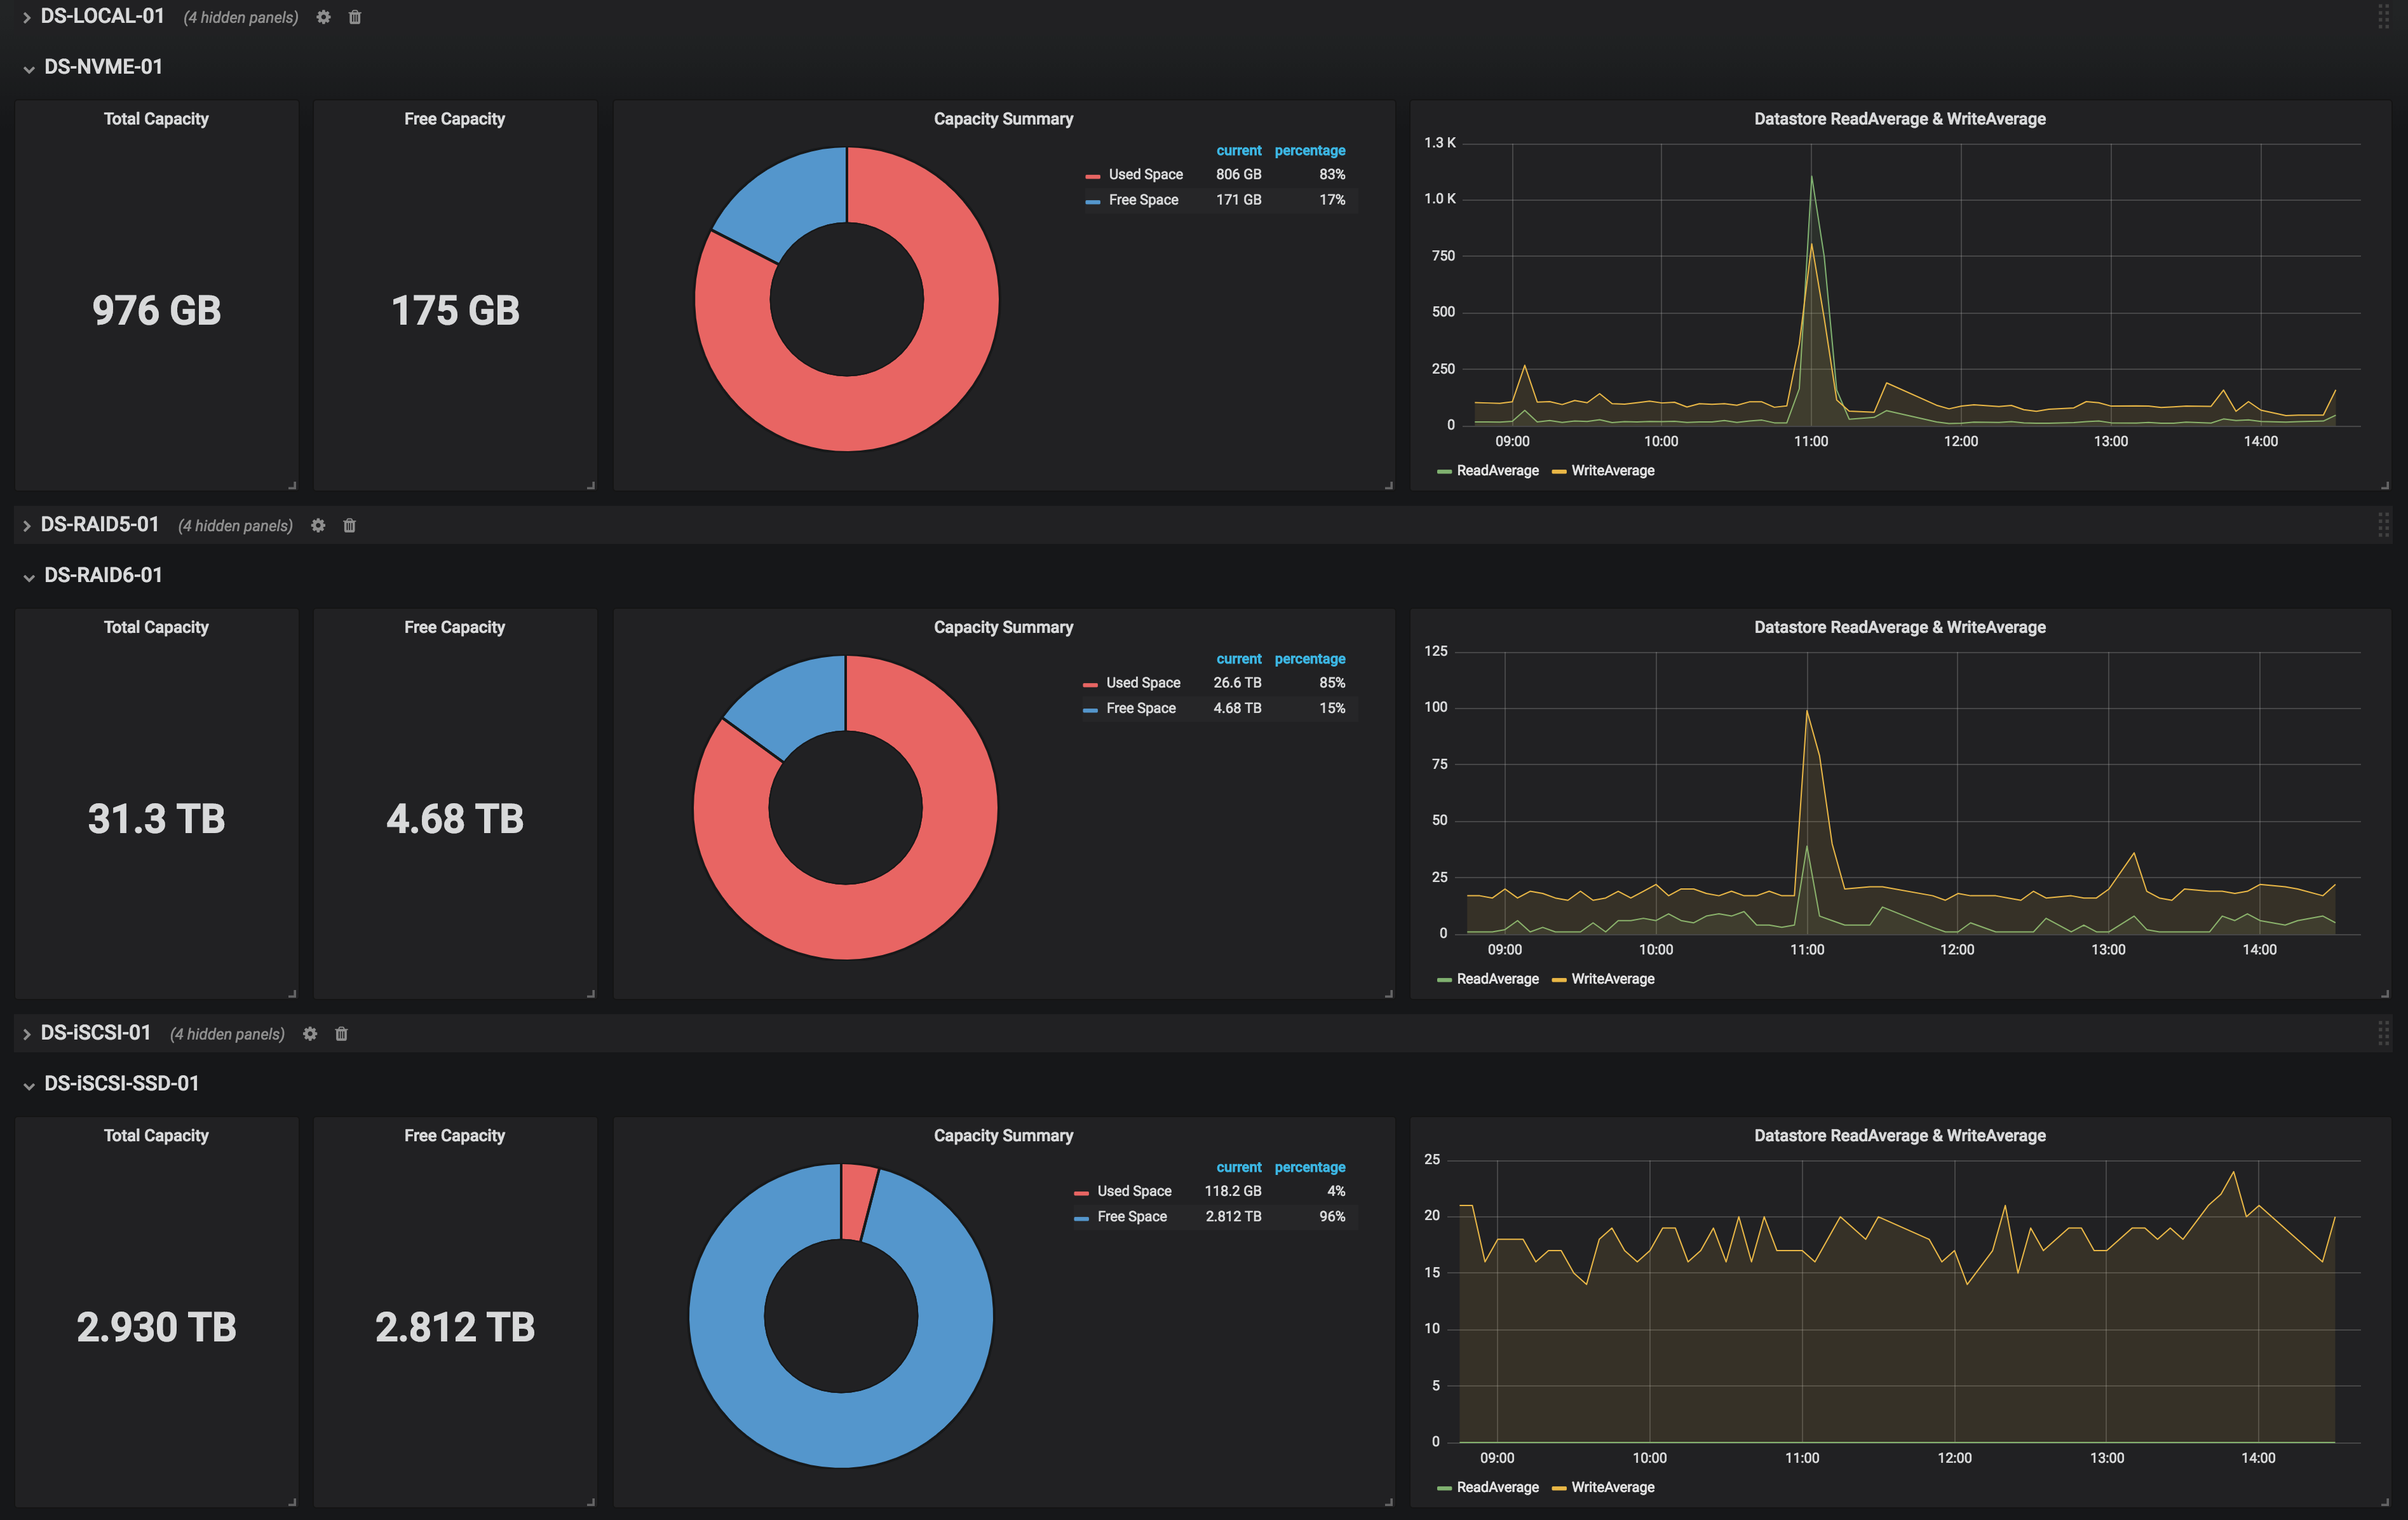 |
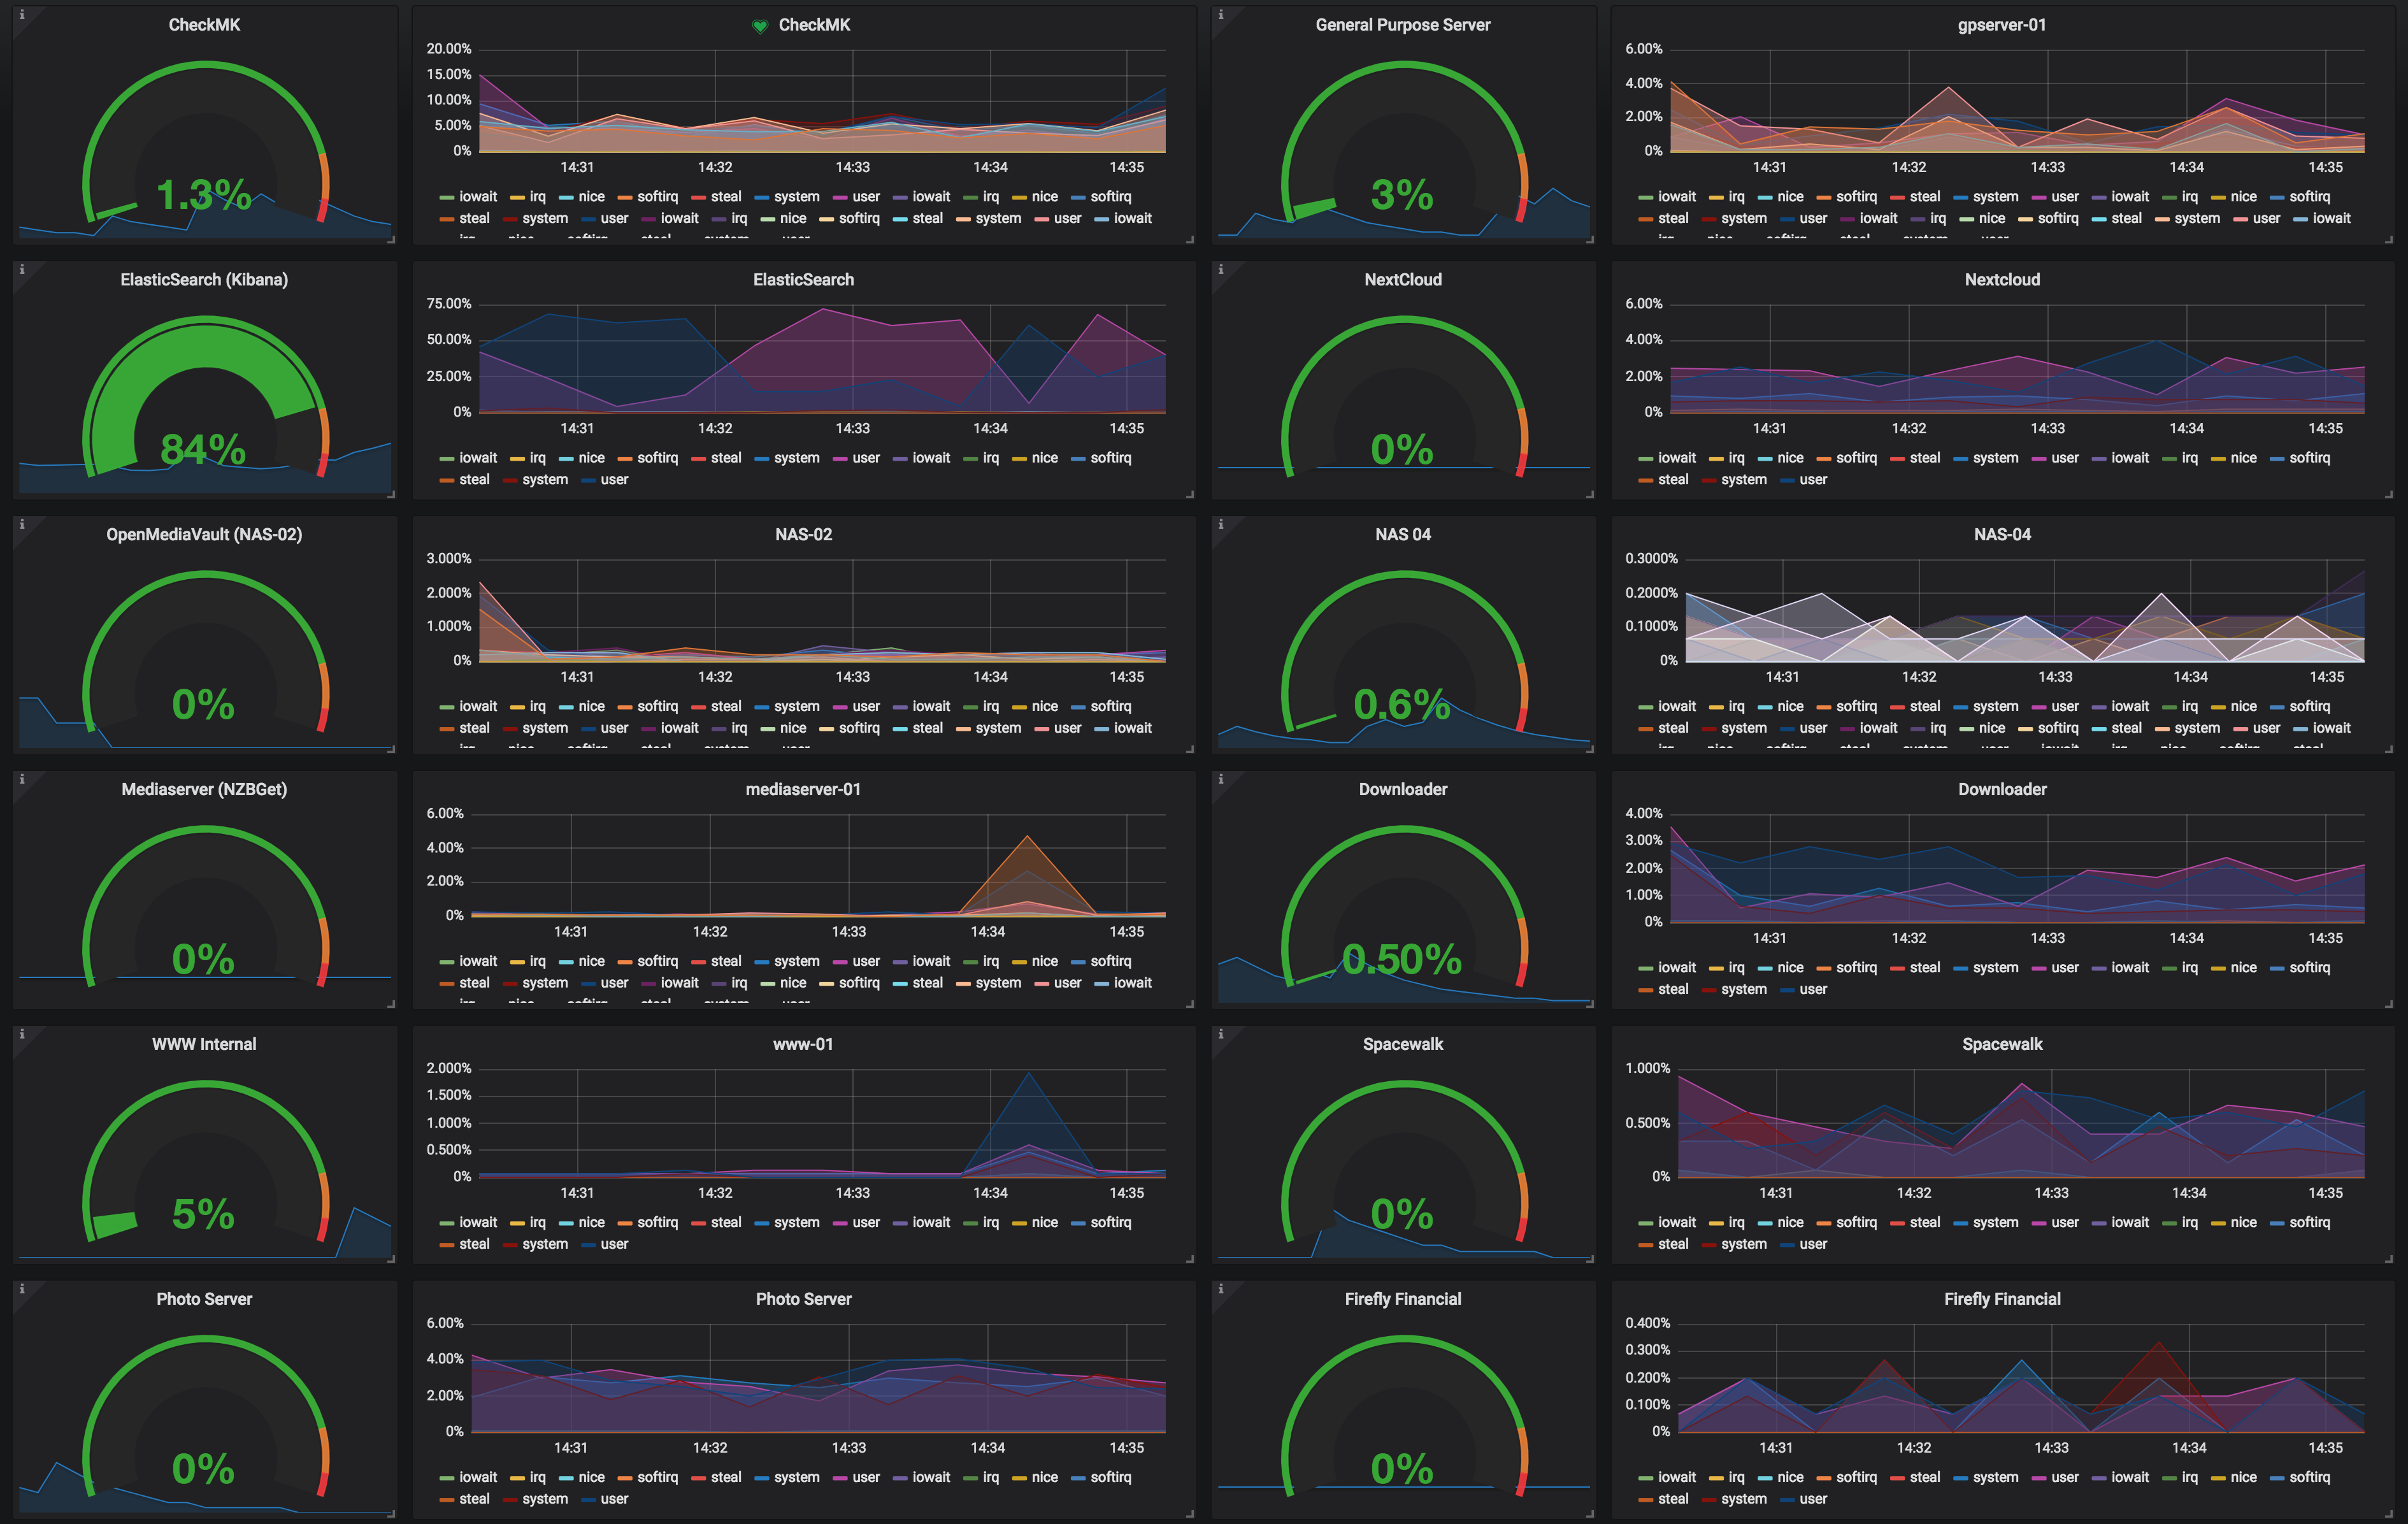
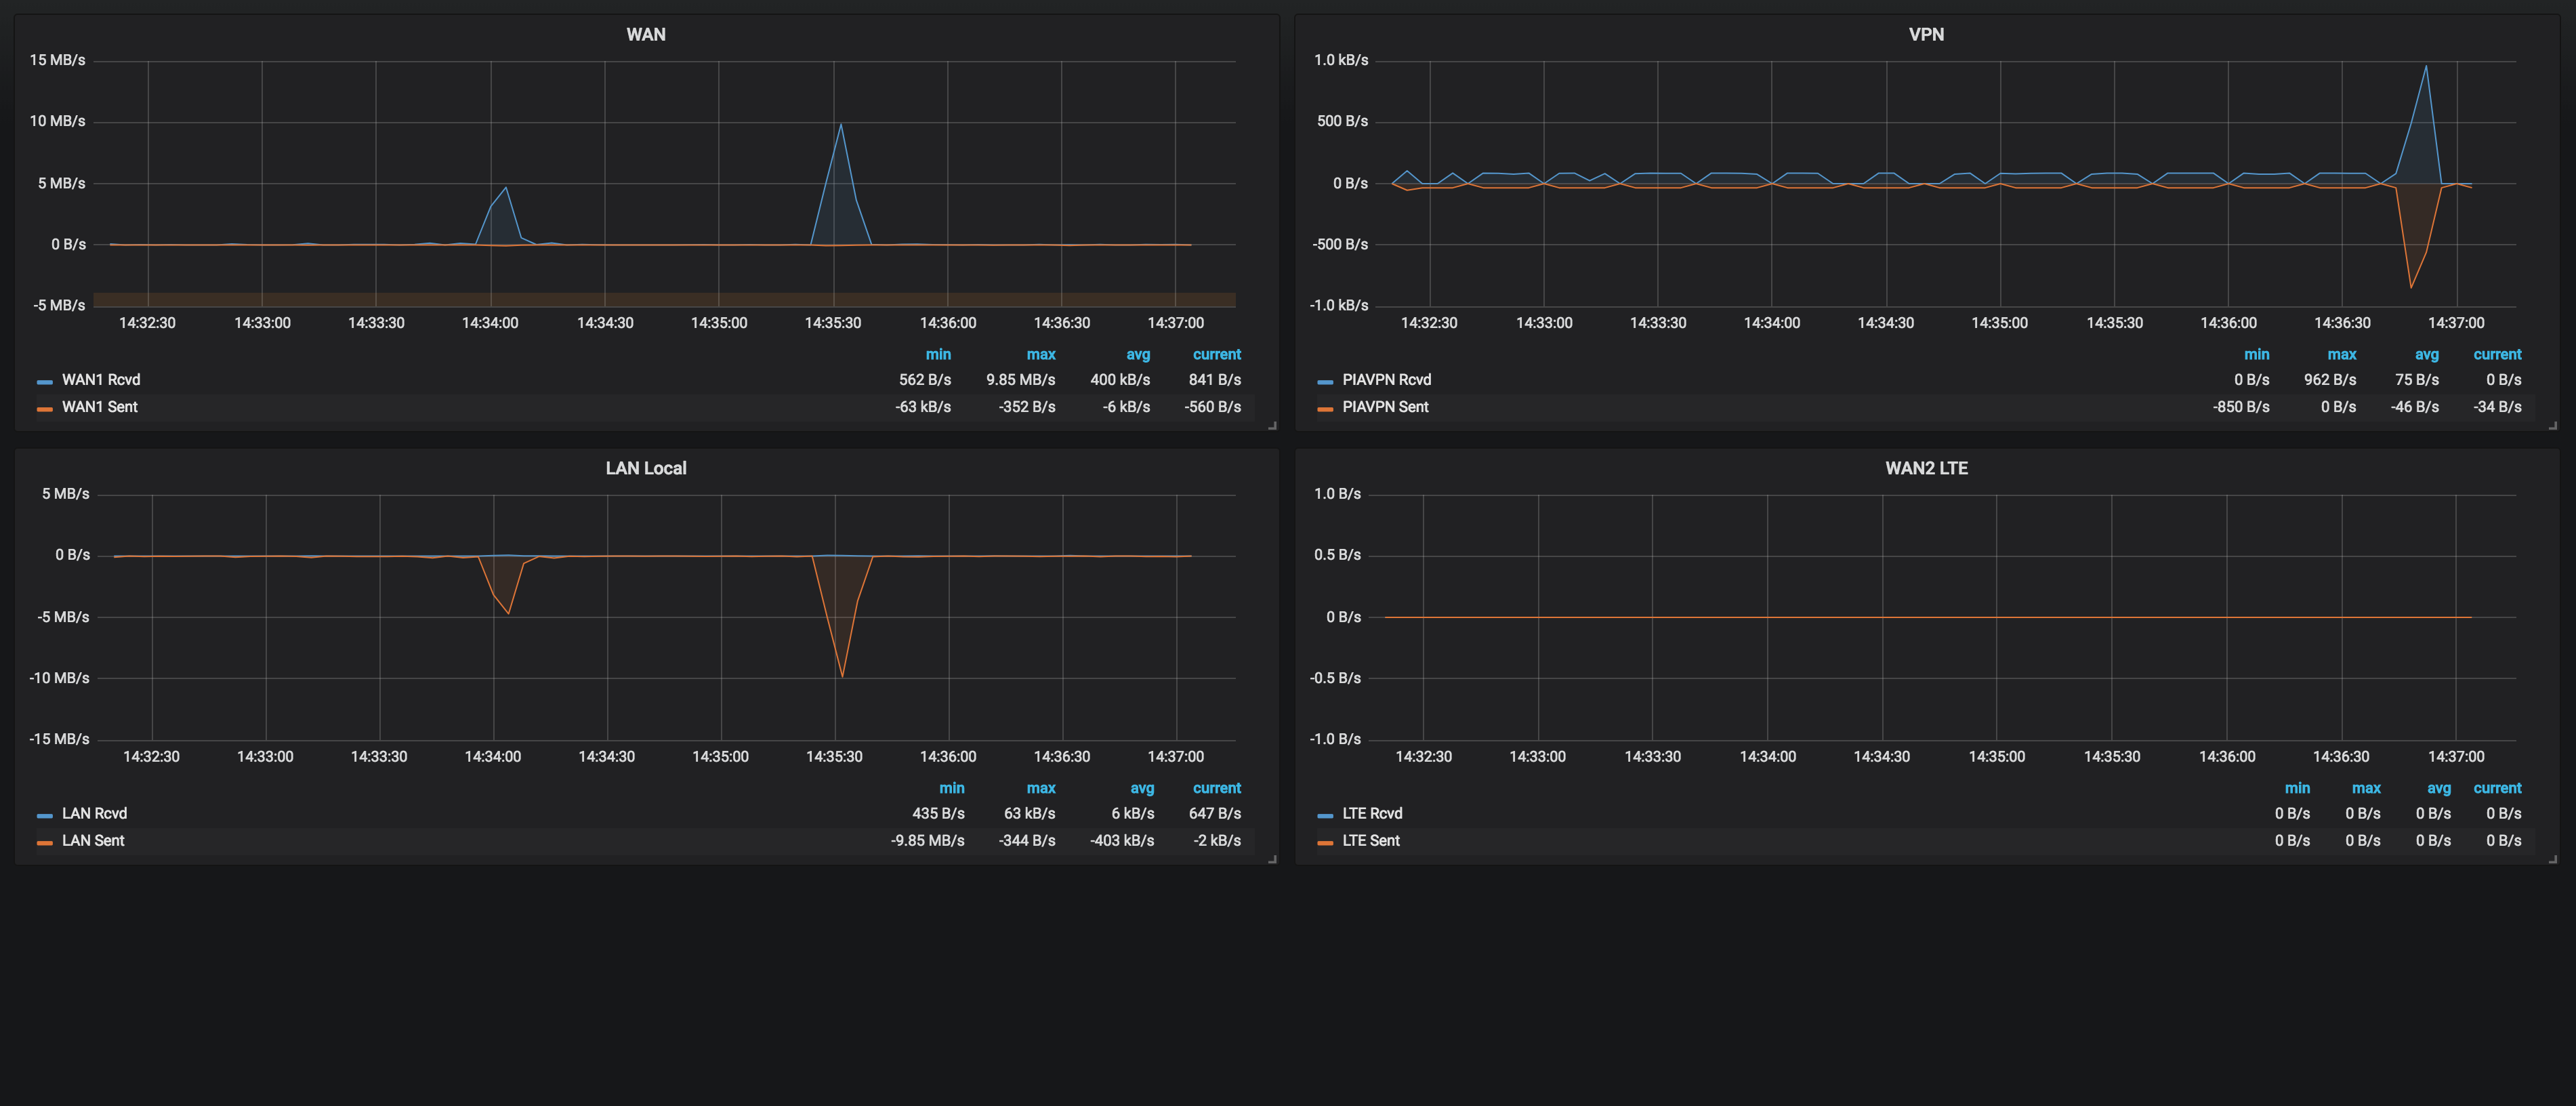
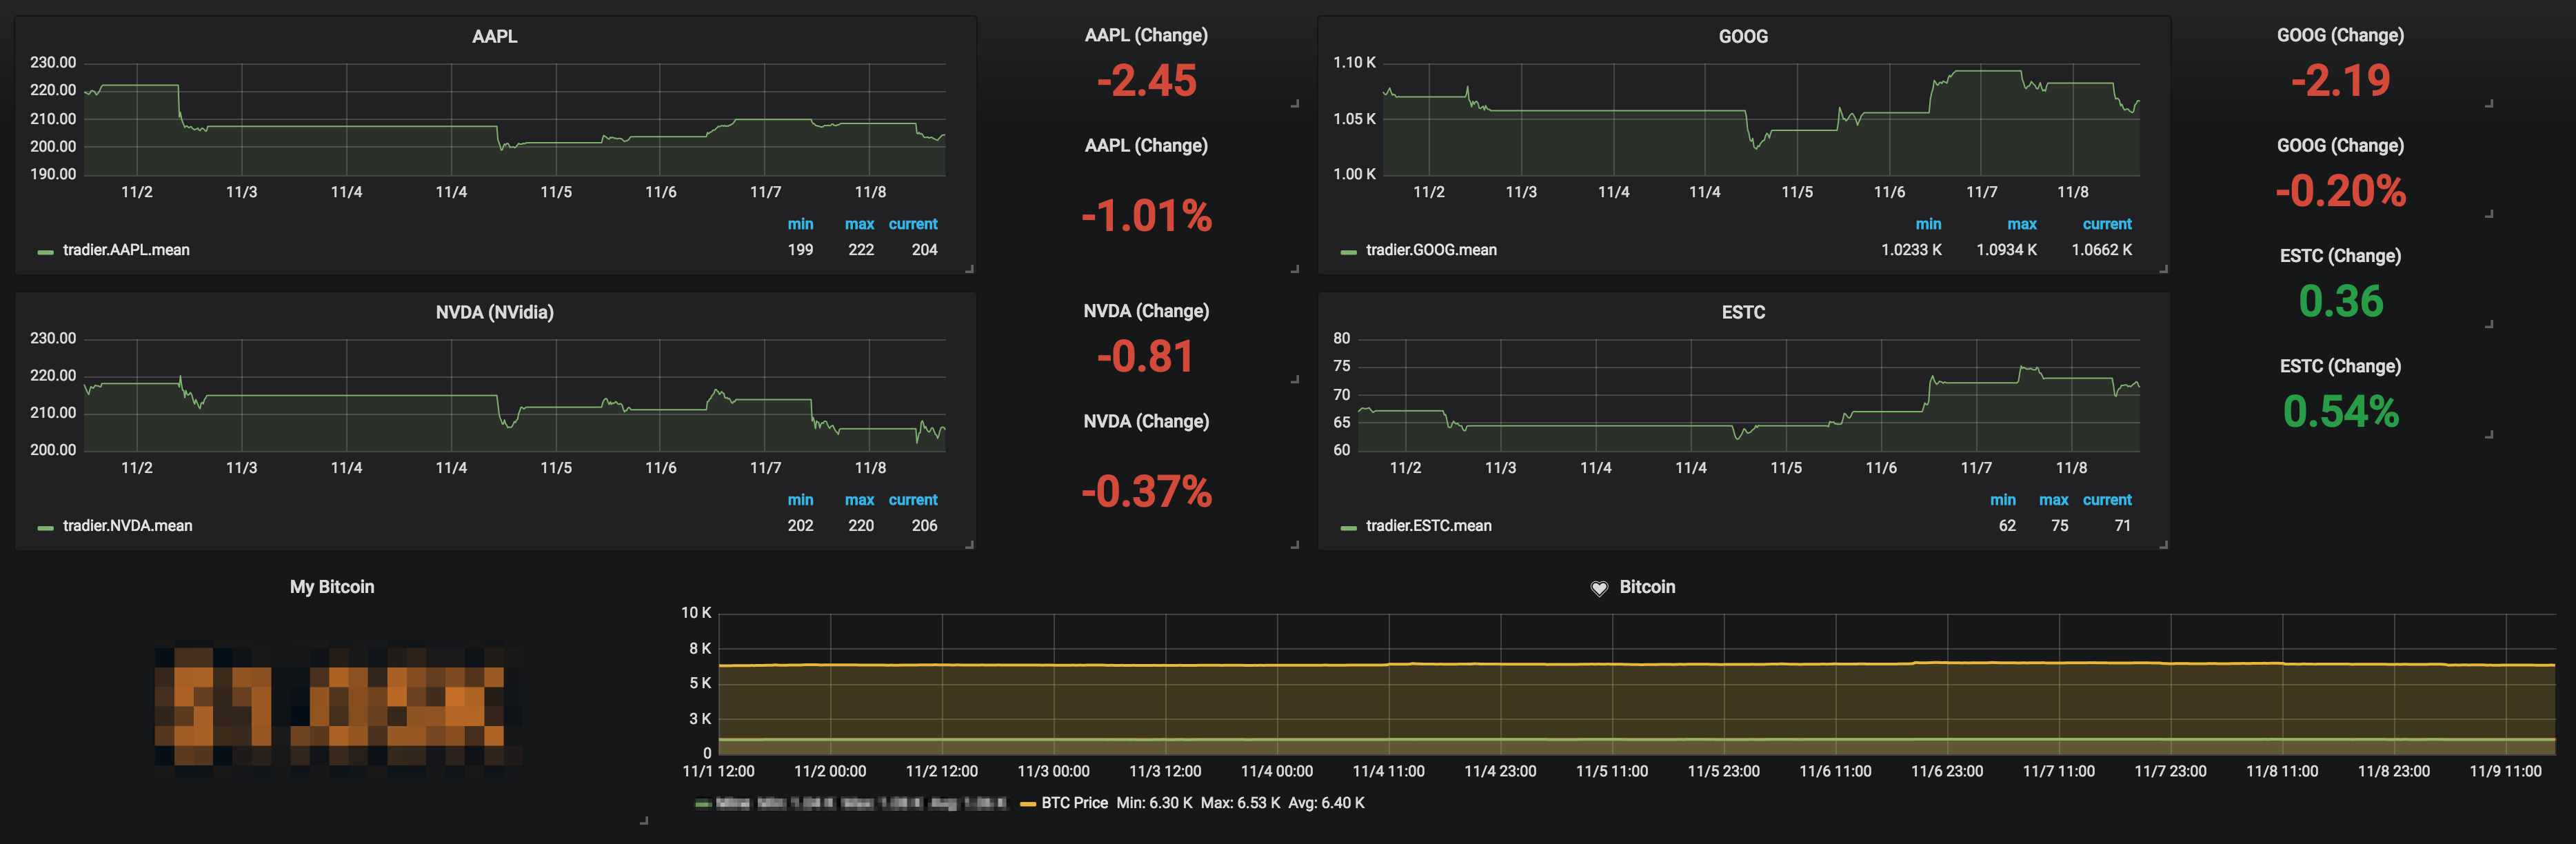
Here’s the Gallery
 |  |
 | |
 | |
 |  |
 |  |
### Technology used:
 |  |
Grafana Dashboards


