Monitoring Uptime Status with Github Actions
I was searching github for some uptime monitoring apps when I stumbled across a github actions based uptime and status page.
It’s aptly named upptime and while it wasn’t what I was looking for, I found it to be novel and worth setting up:
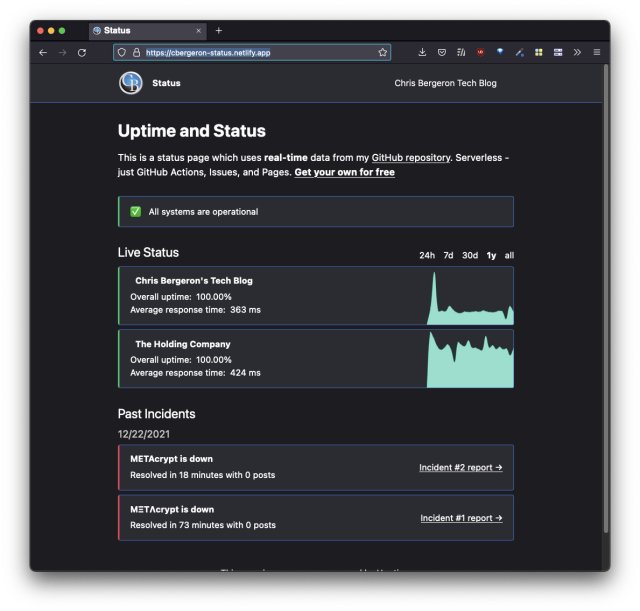
📈 Live Status: 🟩 All systems operational
This repository contains the open-source uptime monitor and status page for Chris Bergeron’s Tech Blog, powered by Upptime.
It’s a brutally honest uptime monitor because it’s automated, free and pipeline based. There are no “approvals” or signoffs required for this status page, so tread carefully if you use it professionally. There may be legal implications for SLA’s, etc.
⭐ How it works
- GitHub Actions is used as an uptime monitor
- Every 5 minutes, a workflow visits your website to make sure it’s up
- Response time is recorded every 6 hours and committed to git
- Graphs of response time are generated every day
- GitHub Issues are used for incident reports
- An issue is opened if an endpoint is down
- People from your team are assigned to the issue
- Incidents reports are posted as issue comments
- Issues are locked so non-members cannot comment on them
- Issues are closed automatically when your site comes back up
- Slack notifications are sent on updates
- GitHub Pages are used for the status website
- A simple, beautiful, and accessible PWA is generated
- Built with Svelte and Sapper
- Fetches data from this repository using the GitHub API
Feel free to view the interactive status and uptime page here.
| URL | Status | History | Response Time | Uptime |
|---|---|---|---|---|
| 🟩 Up | chris-bergeron-s-tech-blog.yml |
|
||
| 🟩 Up | the-holding-company.yml |
|


Monitoring Uptime Status with Github Actions
https://chrisbergeron.com/2022/01/08/Monitoring-Uptime-Status-with-Github-Actions/


