Creating Grafana Annotations with Webhooks
Grafana is a great tool for visualizing data.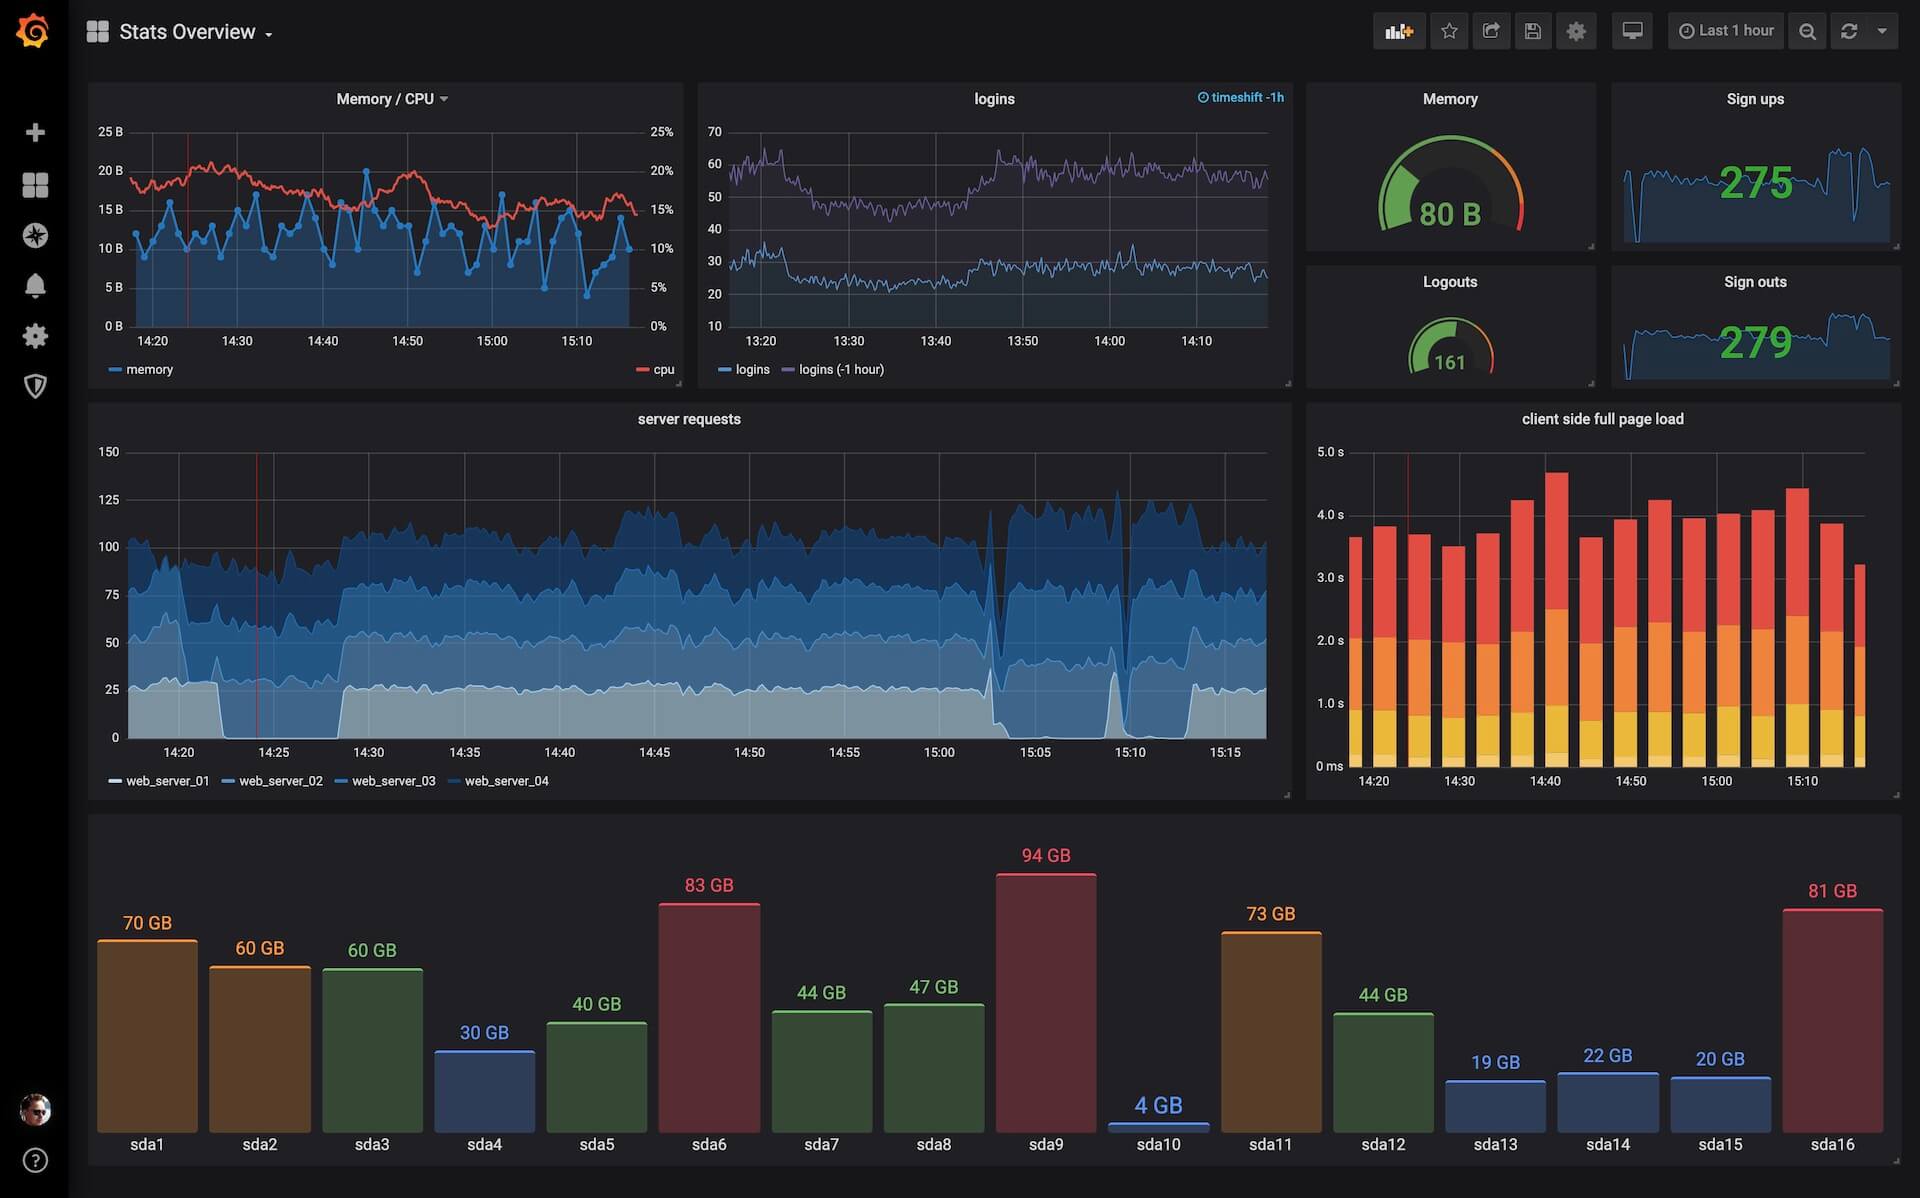
In this tutorial I’ll be putting annotations, or comments on points of interest overlayed on top of graph panels.
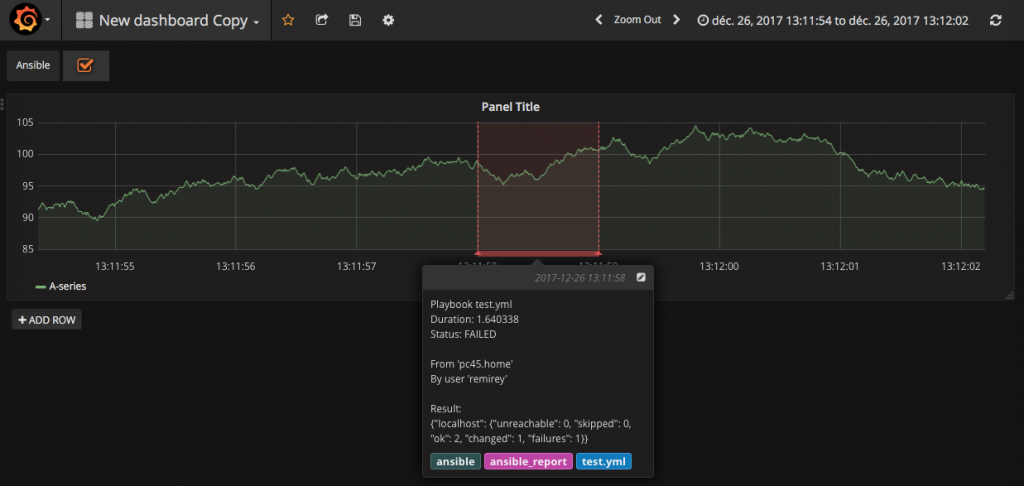
Creating Annotations on Graphs
To create annotations on graphs in Grafana, there are several components that need to be tied together:
- Grafana for the graph(s)
- A database / datasource for our annotations
- An application / webhook that listens for incoming data
The data flows as follows:
An event happens that creates some data that we want to become our annotation. This data needs to be parsed/massaged into a few variables to become an annotation. These values are:
- Start time
- End time
- Name
- Tags
- Description
- Annotation color
Here is an annotation example request:
1 |
|
Let’s break this request down. The first line is the URI Request. As you can see, it’s a POST request for /api/annotations We don’t request a .php or .html file because we use a rewrite rule in the webserver to remove this requirement. We’ll go into that later. The Request Headers are: Accept: application/json and Content-Type: application/json
Next is the request body. This consists of the dashboardId which is the dashboard that has the graph we want to annotate. It also has the panelId which is the actual graph panel we’re annotating. time is the start time of our event in Unix Epoch format. isRegion tells Grafana that this annotation is not just a point in time, but rather a range of time - referred to as a “region’. Since we’re defining a region we specify a timeEnd which is also in Unix Epoch format. Next we have tags. These tags are metadata and are useful for grouping. Finally, we have text which is the description or the annotation itself.
If the request is formatted properly and Grafana parses it successfully, it will send the following Response header:
1 | HTTP/1.1 200 |
If we break this down, we see the Response Header is HTTP/1.1 200 which is the Status-Line. The status-line has 2 parts: the protocol HTTP 1/1 and the status code 200 (Success).
Next is the response body. This consists of 3 json key/value pairs that are the message, the annotation id, and the endId.
Configuring Grafana
Annotations are only available on certain types of Grafana graphs. In this example, I’m using a standard ‘graph panel’. To configure Grafana, we’ll go into the Settings of our Dashboard and select Annotations: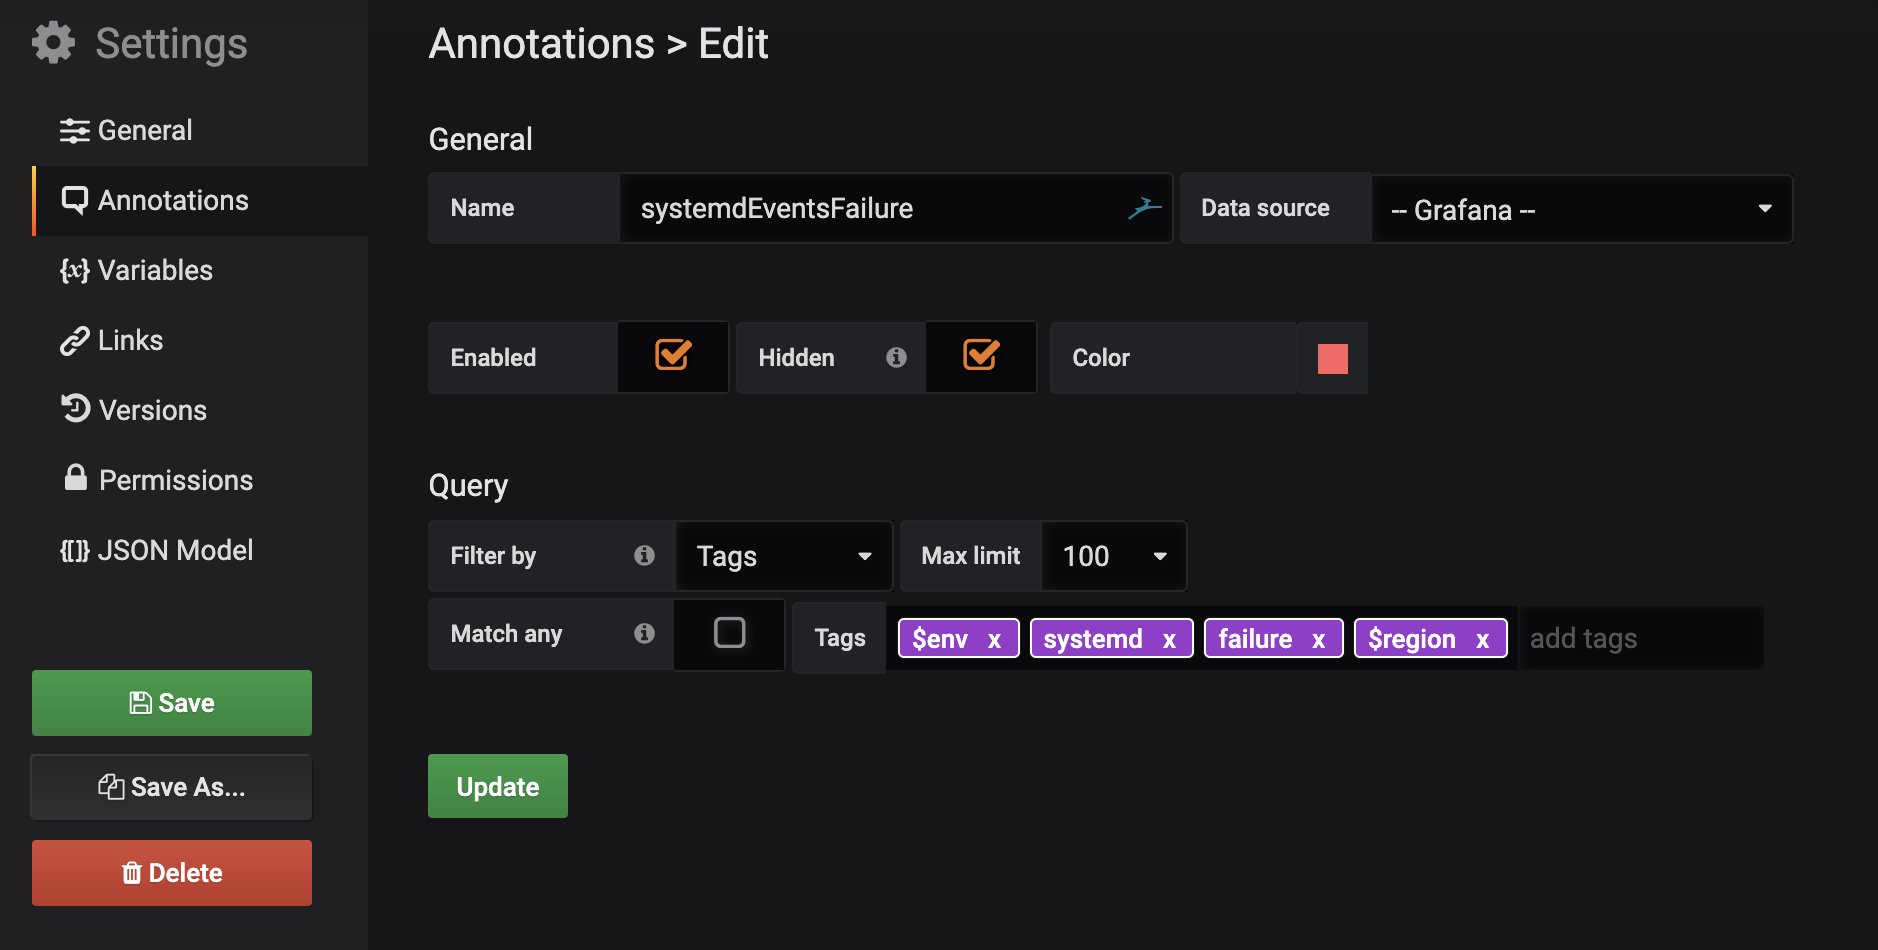
The Annotation Datasource / Database
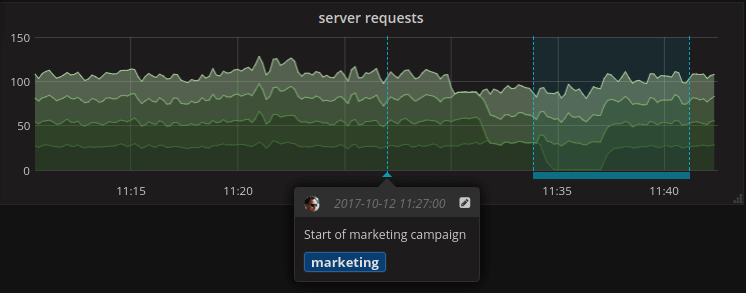
When Grafana renders a graph, it displays the data from the dashboard datasource (a database backend) and it displays the annotations over top of that graph at the appropriate points in time or over a time range.
The Webhook
For this example, I’m using PHP to create the webhook that will listen for incoming data. Once it receives the data that will become an annotation, it parses the data and inserts it into a database. In this example, I’m using InfluxDB. This database is mapped into Grafana as an Annotation Datasource.
Configuring The Webserver - nginx
Now we need to configure our webserver - nginx - for our webhook. The webhook is a .php script that will parse the request (header and body). It massages this data into a format suitable for our database and inserts it. For this example, our webhook endpoint is: /api/annotations (as seen in the request example above). To do this we’ll add the following location block to our /etc/nginx/nginx.conf file:
1 | location /api/ { |
Further Reading
Official Grafana Documentation on Annotations
Official Grafana Annotation API Documentation
Another blog post about Annotations
Technology used
 |  |
Creating Grafana Annotations with Webhooks
https://chrisbergeron.com/2020/03/08/creating_grafana_annotations_with_webhooks/


